Comments
-
What do you think of the traditional past performance model?@Tony Kofalt, my long-ago playing partner (who you met at Saratoga about 15 years ago with me) decided that we should test Ragozin's numbers. We got them every day for a year. They were magnificent. The challenge was that someone had to hand-enter them into a spreadsheet for tracking because there was no data file available.
A similar test with TG was (by comparison) very disappointing.
Those two companies are vastly different today, but those were our experiences.
The concepts behind 02X were quite solid, BTW.
I have and did for a short period of time due to the information being very expensive but then I created my own ThoroGraph "figure" and now I don't buy them since I do the figures myself — Conley
How good are those figs of yours?
Any stats? -
Changed: Allowing us to add threadsAnd a special thanks for changing your mind about allowing us to add threads. — Rich Val
Well, when you're right, your right. -
What do you think of the traditional past performance model?Dave, I can't say that I do like the plot approach. I just presented it as an alternative to RanchWest topic here. The position of the squares and circles are based on numeric ratings. The product suite also presents the numeric data in a spreadsheet. — Tony Kofalt
I agree.
While I could possibly get something out of viewing a graph in a more... conventional configuration, I just don't connect with this one. -
What do you think of the traditional past performance model?How close is "The Studio" to being completed? — Biniak
Have to admit that this new "coding language" thing has tossed my timetable. Not sure but still probably within the next month.
The issue is that I'm hoping to drive almost everything with it so it may pay for itself in terms of hours spent vs. recovered. Should know more in a few day. -
What do you think of the traditional past performance model?I prefer numbers, too. Especially if they are sorted or sortable or color coded or in some one get me to the top horses quickly. The graphical approach is slightly slow for me. I don't mind it as a bonus for replays, but I don't care for the concept for handicapping. — RanchWest
I prefer numbers. The plot is too much graphically. I know you didn't ask me. — Biniak
ANd I prefer numbers about the numbers.
Seriously, that is exactly what I do. -
RS out of PreaknessYes, the horse's shortest previous rest was 22 days and his median rest was 33 days. So, passing on a shorter rest is completely reasonable to me — RanchWest
Interesting.
Do you find those numbers to have significance? -
Fellow Won the Derby Trifecta with ALL button - Does that count?It doesn't matter how you did it. A gazillion people bet that race and very few had the winner obviously. If you walked up to the window and cashed a ticket on that race then Kudos to you. Doesn't matter if you got a tip from a drunk horse walker or you got a tip from Mr. Ed cashing a ticket is what counts in this game. And for those of you too young to get the reference, Mr. Ed was a talking horse on tv in the 60's I believe. — Handiman
After all, you were smart enough to listen to him, right? -
Is there anything New?
Welcome, Milford!
I look forward to you keeping handicapping alive for years to come.
(And vice-versa.) -
CODERS: How to write your own handicapping scripting language?
There is a private group set up and I will put you in it.
[edit]
Done. Just go to the categories and look for 10x Coders. -
CODERS: How to write your own handicapping scripting language?Of course, you do.
LOL
Heck, I can do that right here!
GOOD IDEAS SUPPLIED by STEVEN & RANCHWEST -
CODERS: How to write your own handicapping scripting language?Count me in too. I'm sort of a one horse pony programmer meaning I'm comfortable with only one language but I'm always interested in improving. — Steven
Won't be language-specific.
That would defeat the purpose entirely.
Besides, if I post the code in one's native language, then they use the code without understanding the concepts behind it.
Frankly, I came up with this idea because of you guys. -
What do you think of the traditional past performance model?Ranch merging workout lines in the PP"s has always intrigued me. — Tony Kofalt
Added to my to-do list.
Might make it part of Those Sheet Like Things - as Dick Schmidt dubbed them.
OptixEQ.
I will take a look at this one.
Let me first say that Tom is one of my all- time favorite posters. His work on PA and here is so valuable and often times hilarious. Tom I love the way you took products available at no or very little cost and made them more useful! I've always known these features were there but I've been too stubborn to investigate them. — Tony Kofalt
Boy, do I agree.
If Tom decided to post here every day, the engagement would skyrocket. -
What do you think of the traditional past performance model?Nice work, Jack.
My favorite part is how you've utilized the tool bar (or whatever it's called).
Was that with VBA? -
My Playing Strategy Plus Kentucky Derby, 20221. I use BRIS. From what I've read, horses with a +6, +10, etc Prime Power point advantage win at a very high percentage (of course many times at very low odds like 1-2). How to play? Many do not look vulnerable but still get beat.
Yes, 6 LENs wins a lot of races but are so over bet that removes any chance of making money.
Interestingly, at about 10 lengths the win pct actually starts to got down.
2. How to play small 5 and 6 horse fields where you land on the 8-5 and 2-1. Always separate using jockey/trainer (and other factors), or Dutch? Also, happens in 7+ horse fields, then Dutch?
Those races become highly playable when there are THREE horses under 3/1 on the tote board.
The real leverage point is in exactas.
In the last study I did that included 3 horses under 3/1, the winning exactas when two of those horses ran 1-2 was almost 40% higher than when there were only 2 such horses.
This is because nobody in their right mind would ever box 3 horses below 3/1.
Just imagine... You have (say) 8/5, 2/1, 5/2 and it comes back $18.
But there is a catch... You simply MUST HAVE a BET AGAINST HORSE.
The video actually explains what I do. It works for me.
Like a lot of things I do, I could easily be labeled a crackpot. LOL -
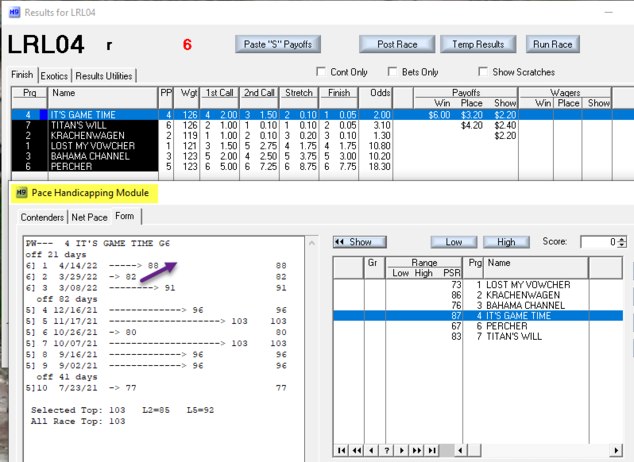
What do you think of the traditional past performance model?I don't know how to directly put in a screenshot, but here is a file that shows a portion of the running lines of today's 4th race at CD for the winner, #1, Hawk of War. Hopefully I've done this correctly. — RanchWest
Easiest Way
1. Save the file to your hard drive.
2. Drag and drop it into the message you are writing.
Meanwhile, you guys keep talking.
Great thread that doesn't need my interferance. -
What being a member here has done for meBy the way, I am not suggesting that all races should be played from the top 3 odds horses. I am just saying that is where most winners will come from. Like, with the races above, 4 winners came from the 5th odds line horse and above. That's about 15%. That might give an idea of a reasonable distribution of selections in the long haul. — RanchWest
That would be an absolute fact.
How do you leverage that to be profitable? -
My New Software is coming: The STUDIO
Oh, and I apologize for my tone in my original reply.
I'm just amazed at how many people call me and say stuff like, "I only play 3 days a month. Can I get your software for free?"
But nevertheless, you did not deserve my tone, so I apologize.

Dave Schwartz

Start FollowingSend a Message