Comments
-
What about jockeys?I'm against them. :lol:
Actually working on getting that into the new software.
Have not had good jockey stuff since my DOS days.
Most powerful is Photo Finish Win Pct. -
My New Software is coming: The STUDIODave - can you tell us more about the roll-out?
Any seminars planned?
Reference material? — stevekisslinger
Too early for that.
Can't record videos until things are finished.
But I'd expect that you'll start seeing screenshots by this time next week. -
My New Software is coming: The STUDIOWhy not do this! Let's say your kick back from HDW is $30 per month from each HSH downloader. You could then take that $30 per month and say if you want to use Brisnet data files the cost in $30 per month or $360 for the year. You could even say if you pay for the year up front, you get a 10% discount and that's $324. I'm sure there are players that would go for that!
If a user pays for one month, after that month the software is locked until you pay for another month or for the year! — Mark
As the president of BRIS said to me 30 years ago, "You don't expect to make a living at this, do you?"
(He offered me a 5% split on the download fees.)
In order to justify investing $150,000 in software development, the cost would need to be $75 per month, plus an annual fee for new upgrades.
It just isn't investable as a business.
That's why the BRIS software is typically so poor. -
My New Software is coming: The STUDIOSeems that is good news for current HSH users. — RanchWest
Well, I'd hope that we'd pick up 100+ new users outside of current HSH users.
There are a lot of horse players who purchase "reports" and spend close to the same amount as this software will provide.
Imagine a whole bunch of selectors and picker for every track.
Imagine unique reports for every track.
The list goes on and on.
Of course, the 3-4 day per month players can never justify spending money on software.
I simply cannot serve that market. -
My New Software is coming: The STUDIOSo, this uses the same data as HSH? — RanchWest
Yes.
That is the only possible business model that works for a software vendor. -
Tom's Ulitmate Odds Line - The SoftwareIt's like what All-Ways software does with listing the top 10 Bris speed ratings. — Mark
Exactly! -
Tom's Ulitmate Odds Line - The SoftwareDave's idea is to take the sorted 6th highest figure and look for an 8/1+ horse that is within that 1st to 6th range. I think Steve probably gets it now. — RanchWest
Not 6th but Top 6.
What is it Dave said in one of his workshops "Often wrong, seldom in doubt". — Steven
One of my favorite quotes, along with one from the TV series, Billions: "I am not uncertain." -
Tom's Ulitmate Odds Line - The Software
I found the one above and removed it. Where is the other? -
Tom's Ulitmate Odds Line - The SoftwareIn other words, what you are describing does not seem to me to be the same thing that s implemented in UOL. — RanchWest
Sorry. When I heard COLLECTIVE SPEED, since I've never heard of anyone other than me using those words, I assumed the discussion was about this thread. -
Tom's Ulitmate Odds Line - The SoftwareHere's a race with 3 double-digit horses, but only 1 qualified as having a speed rating in the top 6. He paid a nice place price at 10/1.
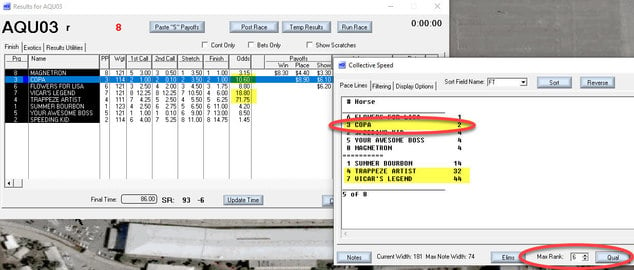
-
Tom's Ulitmate Odds Line - The SoftwareWhat am I missing? — RanchWest
I guess Multi-Caps Collective Speed is not the same as MY Collective Speed. -
Tom's Ulitmate Odds Line - The SoftwareYou guys have misunderstood Collective speed.
Sounds like you are thinking that you are adding them up. Nope.
If you have 10 horses, each with 10 pacelines...
Those 100 pacelines are SORTED BY SPEED RATINGS (highest to lowest) --- INDIVIDUALLY.
What you will find is that 94% of all winners will OWN one of the top 13 speed ratings. (This has no value because there is no such thing as a low-odds horse who doesn't qualify. LOL)
You will also find (as I said in another thread) that a LONGSHOT (really 10/1 and up; used to be 8/1) who has a speed rating in the top 6 can be bet to place. -
A different speed ratingSo they have wager value? — Biniak
The videos show that those point to factors that SHOULD do well when low odds horses that are ranked 1st don't win.


Dave Schwartz

Start FollowingSend a Message