Comments
-
Lurking Long Enough...Thanks, good interview. Very interesting. — RanchWest
If you like that one, try this one.
Using Monty Hall to Handicap (Ray Wallin) -
Lurking Long Enough...
Welcome, Ray!
Glad you're able to find time to get away from your job and all the coaching of kids. -
Belmont 5-29 3rd Race
Apologize for the scratch?
No need for that.
All that trainer analysis is too much work for me, but the tools are their.
Of course I could simply turn those columns into factors and use the factors in objects. -
Belmont 5-29 3rd RaceIt was chaos, but with a solid horse in place to take advantage. — RanchWest
Who won? -
Belmont 5-29 3rd RaceI could go on like that forever, but the truth is that all of that is just too much work for me.
So, I'll just use my objects.
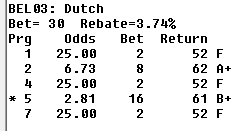
aML 1st Tier
(Who SHOULD be the Low-Odds Horses?)
Just #6 - Two for Charging.
He figures to be very well-bet.
Does he Have Early Speed?
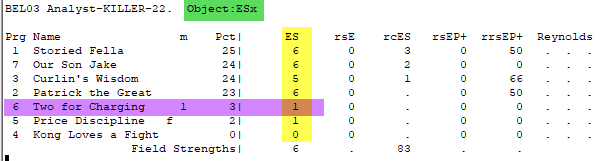
He does not.
BTW, my system for using this object tells me that the ultimate winner will likely challenge for the lead at the 2nd call.
Along with my other conditions for determining how to handle this horse, I have decided that:
6 Two for Charging is BALO - Bet Against Low Odds.
Because I have a BALO who projects to be VERY LOW ODDS and the field is 7 or more, the race is CHAOTIC.
I would NORMALLY do no further handicapping and bet 1,2,4,7.
(The 4 & 7 will be difficult to handicap to the top tier.)
Were I forced to pick contenders in this race, I'd have 2,3,1.
But we have a problem...
The FTS, # 5 Price Discipline.
He aMLs at odds of 2.81. (And that might be high.)
How do we compare a FTS with the others fairly?
FTS Handicap Object.
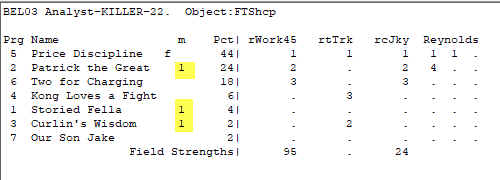
The use is really quite simple and is comprised of a single question.
"Does any FTS have a Pct within 1 point of the 2nd highest contender?"
(Contenders are marked in yellow.)
Since the 2nd-highest contender has a pct of 4, any FTS with 3 or more pct should be considered a contender. Therefore, #5 qualifies.
So, we wind up with this:
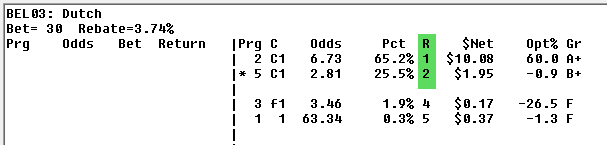
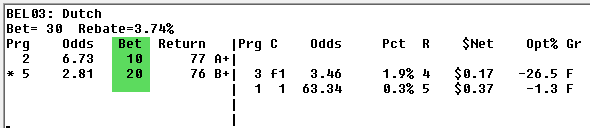
And gets bet like this:
FOR CLARITY...
My approach to this race would be to bet CHAOS.
However, because of the FTS, I have no idea how to play because I skip such races.
My gut feeling would be 2 & 5 as shown above.
Exactas would be:
2-5 (box)
(2-5) / (6) (one way)
The safe way for me to play this race is to take a stand against the favorite and #3.
Exactas would be:
(1-2-4-5-7) / 6 (one way) -
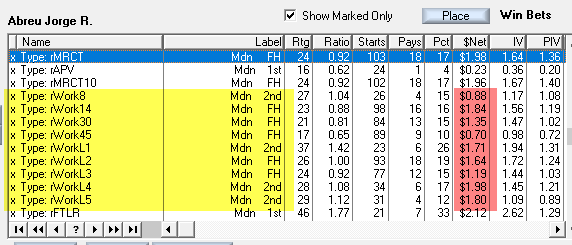
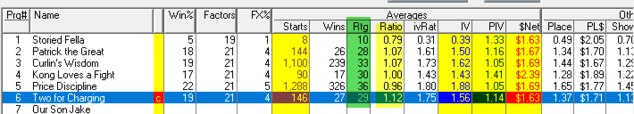
Belmont 5-29 3rd RacePERFORMANCE RATINGS
This is how each starting RANKS in 54 different factors.
Examples are:
- ES Points
- Class of Last Race
- Avg Competitive Level
- Works in last 8,14,30,45 days.
- Speed Ratings in 13 different ways.
(Doubt that you've ever seen a report like this from any other source.)
If you are a believer in Workouts...
... checkout his $nets.
BTW, the most important Workout Factor is Best Workout in the last 45 days.
Of course, that is across all races, for all trainers.
Trainers have their own approach. -
Belmont 5-29 3rd RaceTo me the likely favorite and probable winner is the 5- Price Discipline. — Tony Kofalt
5- Price Discipline
Some Data...
Trainer Stats
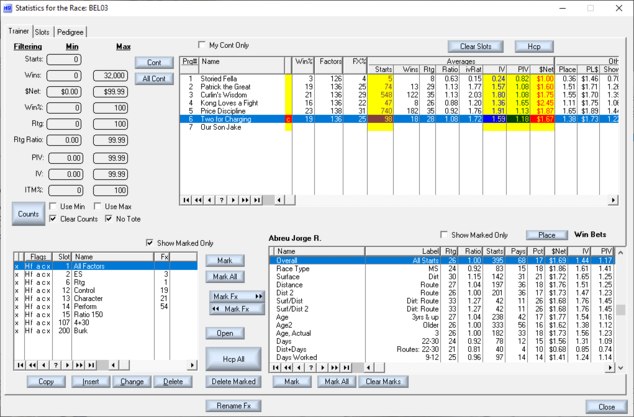
zoom in...
1. His win% is not even the best in the field.
2. Only 18 wins over the past several years with horses like this one at NYRA.
3. His RTG ("Rating using 6-3-1) is a just OK but not best.
4. RATIO this means the RTG of this horse to all his starters.
1.08 is not something to get excited about.
(The excitement starts about 1.25.)
Ironically, a fav with a weaker-than-expected trainer is actually a GOOD SIGN.
After all, how does such a horse become a favorite? Certainly not because of the trainer.
His weak spot is, of course, his lack of Early Speed.

But when we look at his Trainer Stats at Early Speed Factors...
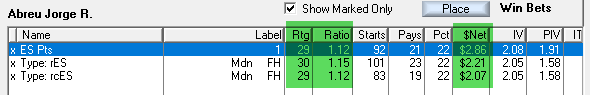
... We find his numbers are ALL good.
And his $2.86 $Net glows in the dark.
When we look at his GO SIGNS...
(i.e. Ratios of 1.50 or higher.)
... we find quite a few things.
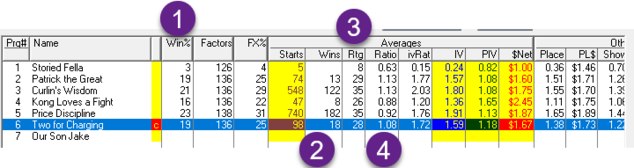
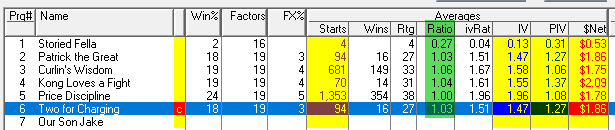
Let's put this in perspective and compare to the rest of the field.
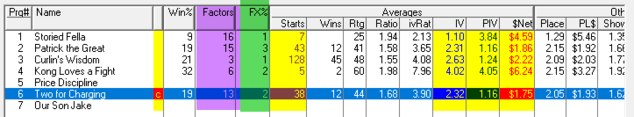
The important things here are:
FACTORS (Purple)
This means that #6 has 13 factors (out of 147) that have Go Signs of 1.50+.
By comparison, #1 & #2 are higher.
FX% (Green)
This is - by far - the most important trainer stat when it comes to low-odds horses.
It is nothing but the 1st 2 columns multiplied together:
Win% x Factors
19% x 13 = 2.47, rounded down = 2.
BTW, the win% uses the IVs from the horses for each trainer who have go signs.
CONTROL FACTORS are...
... things the trainer has control over.
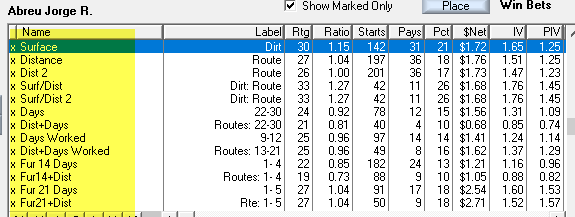
Better to look at the field in context.
Most important here is RATIO.
Since High ratios = Go Signs, we're looking for trainers who have found a race that FITS THEIR STYLE.
Nobody in this field is more than average.
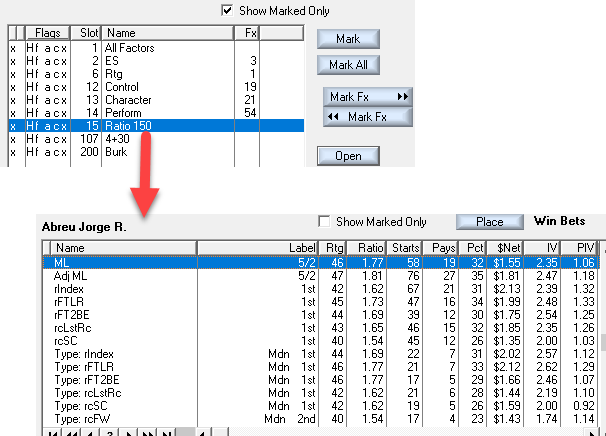
TRAINER CHARACTER
Not a comment about whether or not you should lend him money. LOL
Actually these 21 factors are about the kind of horses, races, and situations he is good with.
For example, this is very important with young horses. Some trainers are amazing with 2-year old fillies but not so good with colts at that age.
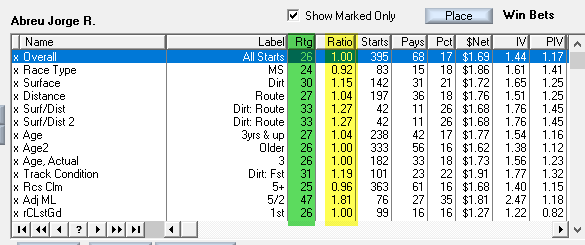
RTG & Ratio are what drive this.
Look at "Adj ML" in the 5/2 range. "47" is a good number.
But I'd prefer the 5,000-foot level.
Here's the race:
I'll continue in the next reply because there might be a limit on number of pics in a post. -
Researching negativesWhen it comes to negative factors, it seems to me that Pickmaster was used in HSH to identify negative factors some years ago. I don't recall the outcome but it felt like a worthwhile venture. — Tony Kofalt
It used to work very well for negatives but that stopped about 2016 when the 1st public choice became extremely efficient in the market.
Now, it works quite differently.
One must find the BEST factors and understand the "RATIO-of-RATIOS" and "1stROR." Both of those are fully explained in Percentages & Probabilities 2022.
(It is a highly-visual explanation.) -
Researching negativesRespectfully, single race examples have only slightly better than zero value.
The answer must be verified with much larger samples.
Without a few hundred negative picks made either completely rule-based or before hand, it's all anecdotal.
That's why I react so negatively when someone speaks of building models in notebooks: in order to do research, one must look across dozens of pages in such a notebook. -
Researching negativesRanch right now I am keeping track of track biases and specifically looking at poor/bad or "negative" biases that I can see
I am doing almost 99% of the tracks on North America right now and have data starting from the start of this month if anyone wanted a quick sneak peek of what I do (which is probably nobody) — Conley
Are you doing this in a spreadsheet? -
Researching negativesI also flag horses with troubled trips. I figure that a horse should also be forgiven for the occasional troubled trip, but when it keeps happening, maybe it isn't a coincidence. — RanchWest
Please tell me about HOW you do that.
I'm designing a note-taking & searching process in The Studio, and, not being a note taker myself, I'm a little lost. -
Researching negativesI am currently working on tracking jockey troubled trips. I know that a troubled trip can happen to any jockey at any time. But I am thinking that jockeys that have a lot of troubled trips may not be very good wagers. What do you think? — RanchWest
How are you doing that?
Comments? -
Tom's Ulitmate Odds Line - The SoftwareI'm trying to figure out how to share this photo. I'll see what I can come up with because the "Image" and "Upload Files" ways aren't working at the moment. User error, most likely. — Lawrence
Before I tell you how please I am to see you here - just pretend I didn't say that - let me tell you the easiest way to upload a file. OH! You figured it out!
I LOVE what you are doing.
Let me know how I can help.
BTW, I will predict that what you find from your spreadsheet work will work but not the way you think.
I'll guess that you will find that the obvious horses are what have been dubbed BOLOs by the locals. Can't recall at the moment whether it was @RanchWest, @Biniak, or @Steven, but it was definitely one of them
A BOLO is a BET AGAINST LOW ODDS horse.
Congratulations on some nice work.
#BOLO -
2022 Preakness StakesI'm so confused. Fenwick bet down to 7/1??? — Dustin Korth
Fenwick finished last, 40 1/2 lengths behind. — RanchWest
Probably just got a bad trip :lol: — Dustin Korth
Hey that was my 10k bet you're making fun of. — Biniak
My condolences. The memorial service will be on Tuesday. — RanchWest
My next line is I was the jockey. So don't say "bad ride", it was just nerves. — Biniak
You guys are hilarious.
:rofl: -
Picking Losers is the Best Whale Killer
First line in my post.
(This is a re-release of a blog post from PaceMakesTheRace.com.) — Dave Schwartz
The concepts are still solid.
BTW, I spent some time researching my current approach and think I have found a way to improve it.
Needs more races.


Dave Schwartz

Start FollowingSend a Message